100+ essential penetration testing statistics [2023 edition]

If there’s anything we learned from years of working in infosec is this: don’t make assumptions without knowing the context and make decisions based on reliable data.
With that in mind, we’ve put together this extensive list of penetration testing statistics and relevant data that shed light on many aspects of the industry.
Why are we doing this? Because it helps infosec specialists like you to get the information they need to maintain a high-level perspective while also supporting initiatives such as:
asking your manager for budgets
advocating for new team members to fill in specific gaps
highlighting the real business impact of people, processes, projects, and technology.
Dig into these detailed (and often surprising) pentesting statistics to find out what’s going on in the industry and how it impacts your day-to-day activities.
Vulnerability and pentesting data
The ever-expanding threat landscape continues to impact companies globally and affect their critical infrastructure. For example, 2022 registered a record-breaking growth year for CVE data with over 25,000 published. On average, there were 68.75 CVEs published per day.

That’s why it helps to take a closer look at these vulnerabilities statistics and trace their impact:
404 high-risk vulnerabilities with CVSSv3 10.00 and RCE access published in 2022. By comparison, 2021 saw 363 of these. (CVE Details)
According to the same database, 860 vulnerabilities with CVSSv3 scores of 9.0 - 10.0 emerged in the tech ecosystem in 2022. 2021 registered 1165 vulnerabilities.
Over 13,000 vulnerabilities were published in 2022, 3238 of which were flagged with CVSSv2 scores (from 7.0 to 10.0). There were 40% fewer vulnerabilities in 2021, which recorded about 21,000 vulnerabilities. (National Vulnerability Database)
Cobalt’s State of Pentesting 2022 points out the top 5 most frequent vulnerability categories the pentesting community discovered: Server Security Misconfigurations (38%), Cross-Site Scripting (13%), Broken Access Control (11%), Sensitive Data Exposure (10%), Authentication and Sessions (8%).
At least 66 zero-day vulnerabilities appeared in 2021. The fast proliferation of hacking tools on a global scale is a contributing factor to this growth rate. (MIT Technology)

A report says there were 20,174 security vulnerabilities (CVEs) published in 2021, compared to 17,049 in 2020. The 3 most common ones were: XSS, memory corruption, and SQL. (Stack Watch 2021 Vulnerability Report)
62% of security teams said they experienced zero-day exploits in 2022, up from 51% in 2021, which were linked to geopolitical issues. (VMWare Global Incident Response Threat Report 2022)
On average, security teams needed 14 days to fix vulnerabilities. (Cobalt’s State of Pentesting 2022)
Statista says that over 1 million companies worldwide use the Microsoft Office 365 suite. So it’s no surprise it remains an attractive attack vector.
The top 3 most notable critical Microsoft vulnerabilities, which CISA added to their list of most exploited vulnerabilities in 2021, are ProxyLogon (CVE-2021-26855 and CVE-2021-27065), ProxyOracle (CVE-2021-31196 and CVE-2021-31195), and ProxyShell (CVE-2021-34473, CVE-2021-34523, and CVE-2021-31207) (HelpnetSecurity).
More data from the AppSec Stats Flash report indicates that remediation rates for critical vulnerabilities saw a decline from 54% in 2020 to 47% in 2021.
The deeper we go into vulnerability data, the more visible the importance of vulnerability scanning and prioritization for companies becomes.
Vulnerability assessment statistics
Vulnerability assessment (VA) is an essential process for businesses that want to identify and understand high-risk vulnerabilities in their attack surface before attackers have a chance to exploit them.
Check these stats to see how other organizations fare and what goals cybersecurity peers have in this area:
Over the next 5 years, the VA market will grow at a 10% CAGR (Compound Annual Growth Rate) (Mordor Intelligence Report)
One in five organizations do not test their software for security vulnerabilities (Ponemon Report: Application Security in the DevOps Environment)
70% of organizations have a vulnerability assessment tool - deployed internally or provided as a third-party service (2022 Vulnerability Assessment Analytical Note)
70% of respondents acquired a vulnerability assessment tool for proactive security measures (2022 Vulnerability Assessment Analytical Note)
52% of them want to change to a new assessment solution to reduce false-positive alerts (2022 Vulnerability Assessment Analytical Note)
According to the 2022 Vulnerability Management Report from Fortra, when evaluating solutions, cybersecurity professionals mentioned vulnerability assessment (70%) on their top list of required features, followed by asset discovery (66%), vulnerability scanning (63%), and risk management features (61%).
Vulnerability management figures
The staggering number of vulnerabilities highlights the need for an effective vulnerability management program. But do organizations really prioritize vulnerability management practices?
Data from the 2022 Vulnerability Management Report show that 71% of organizations run a formal vulnerability management program in-house, but only 30% of them consider their program very effective. But the good news is that 44% of organizations expect an increased investment into vulnerability management solutions.
Let’s see more helpful vulnerability management data to see what happens when theory meets practice.
The National Institute of Standards and Technology (NIST) recommends vulnerability scans to run at least monthly and even more frequently for organizations that collect and/or process personal or sensitive data.
31% of IT pros do their own vulnerability scanning, while another 33% say they don’t do any regular vulnerability scanning. (RapidFireTools Survey)
59% of organizations do not plan on prioritizing vulnerability management in 2022 (2022 Endpoint Management and Security Trends Report)
Only 4 out of 10 organizations prioritize endpoint vulnerability management in 2022 (2022 Endpoint Management and Security Trends Report)
Information security is the most common group within organizations responsible for overall vulnerability management (74%). It focuses on remediation activities such as patching (67%) and configuration management (69%) (SANS Vulnerability Management Survey 2020)
The same SANS survey shows that 18% of respondents automatically scan for vulnerabilities or misconfigurations in their cloud PaaS environments. 22% of them do so in cloud SaaS environments.
The market will grow from USD 6.7 billion in 2020 to USD 15.86 billion by 2030, at a CAGR of 9% during the forecast period 2021-2030. (PRNewsWire.com)
The Vulnerability Management Guidance Framework from Gartner indicates some important areas of focus when evaluating this process:
Vulnerability management guides other critical areas that need security improvements in organizations.
Identifying critical vulnerabilities is one of the main objectives of the VM process.
Successful VM programs support advanced prioritization techniques and automated workflow tools. Why? To streamline the handover to the team responsible for vulnerability remediation.

Vulnerability prioritization – key data
An essential aspect of the vulnerability management program is vulnerability prioritization.
With so many high-risk vulnerabilities – and based on their CVSS score – this phase is vital to close potential security holes and reduce adversaries’ window of opportunity.
So let’s take a closer look at some important data infosec leaders should focus on when prioritizing:
With a record of over 25,00 vulnerabilities disclosed in 2022, we observe a rapid growth of the threat landscape. (The Stack)
The SANS Vulnerability Management Survey findings indicate that prioritization maturity has improved in 2022 with companies moving from Level 3 (defining) to Level 4 (quantitatively managed) and Level 5 (optimizing). Both Levels 4 and 5 grew by 6.3% and 2.2% respectively in 2022 from the previous year.
Members of our community shared their perspectives and experience on the topic in the comments of this survey on LinkedIn.
Only 33% of organizations prioritize implementing Zero Trust and multifactor authentication (MFA) (2022 Endpoint Management and Security Trends Report)
34% of businesses don’t prioritize risks for their IT teams. (TAC Security Survey)
88% of businesses review security risks on their own, rather than using a vulnerability management solution. (TAC Security Survey)
These stats show that prioritization is still lacking standardization as part of vulnerability management. Since it’s a nuanced process with complex implications, companies still have a long way to go to significantly reduce their exposure caused by high-risk vulnerabilities.
The State of Vulnerability Management in DevSecOps (2022) emphasizes the following:
56% of respondents say their organizations use automation to assist with vulnerability management. Of them, 47% say prioritization is automated.
52% of them say prioritizing critical vulnerabilities inside their companies is very effective, while 43% indicate patching is highly effective.
33% think they need to have a focused approach to prioritization and remediation of risks so they can adopt DevSecOps.
A 2021 Carnegie Mellon University whitepaper talks about a decision-making process based on decision trees.

Source: Carnegie Mellon University
Pentesting automation statistics
When it comes to automated penetration testing, it helps to get more insights into how this process can reduce the amount of tedious, manual tasks – without sacrificing nuance and quality. In our book, that always involves valuing human expertise.
Let’s explore some of the most relevant penetration testing automation statistics:
75% of companies perform penetration tests to measure their security posture or for compliance reasons. 57% of them do it to support a vulnerability management program. (CoreSecurity 2022 Penetration Testing Report)
Most penetration testers use a variety of security tools during engagements, with 78% using both free and commercial tools, while 11% of them rely on free and open-source tools. (CoreSecurity 2022 Penetration Testing Report)
In terms of the most important features in paid pentesting software tools, 77% of companies said reporting is a must-have. 67% buy extensive threat libraries, while 61% are interested in multi-vector testing capabilities. (CoreSecurity 2022 Penetration Testing Report)
Vulnerability scans can identify over 50,000 unique external and/or internal weaknesses. (SecurityMetrics)
Servers, web applications, and databases are the top 3 areas of focus for automated penetration testing. (RidgeSecurity Survey)
Only 29% of organizations have automated 70% and more of their security testing. (2021 SANS Survey)
44% have included security tests and reviews as part of coding workflows. (2021 SANS Survey)
Penetration testing market interest data
If you work in offensive security, you’re probably curious to discover:
how big the interest in the penetration testing market really is
what users search for on Google or YouTube about this topic
which are the top penetration testing pages and profiles with the most followers on LinkedIn or Twitter
and more insightful market data.
We’ve gathered them for you below:
31k+ followers on Linkedin use the penetration testing hashtag to share and stay up to date with the latest news and insights on this topic.
Other 34k+ people are interested in #pentesting and follow this hashtag to keep an eye on this space.
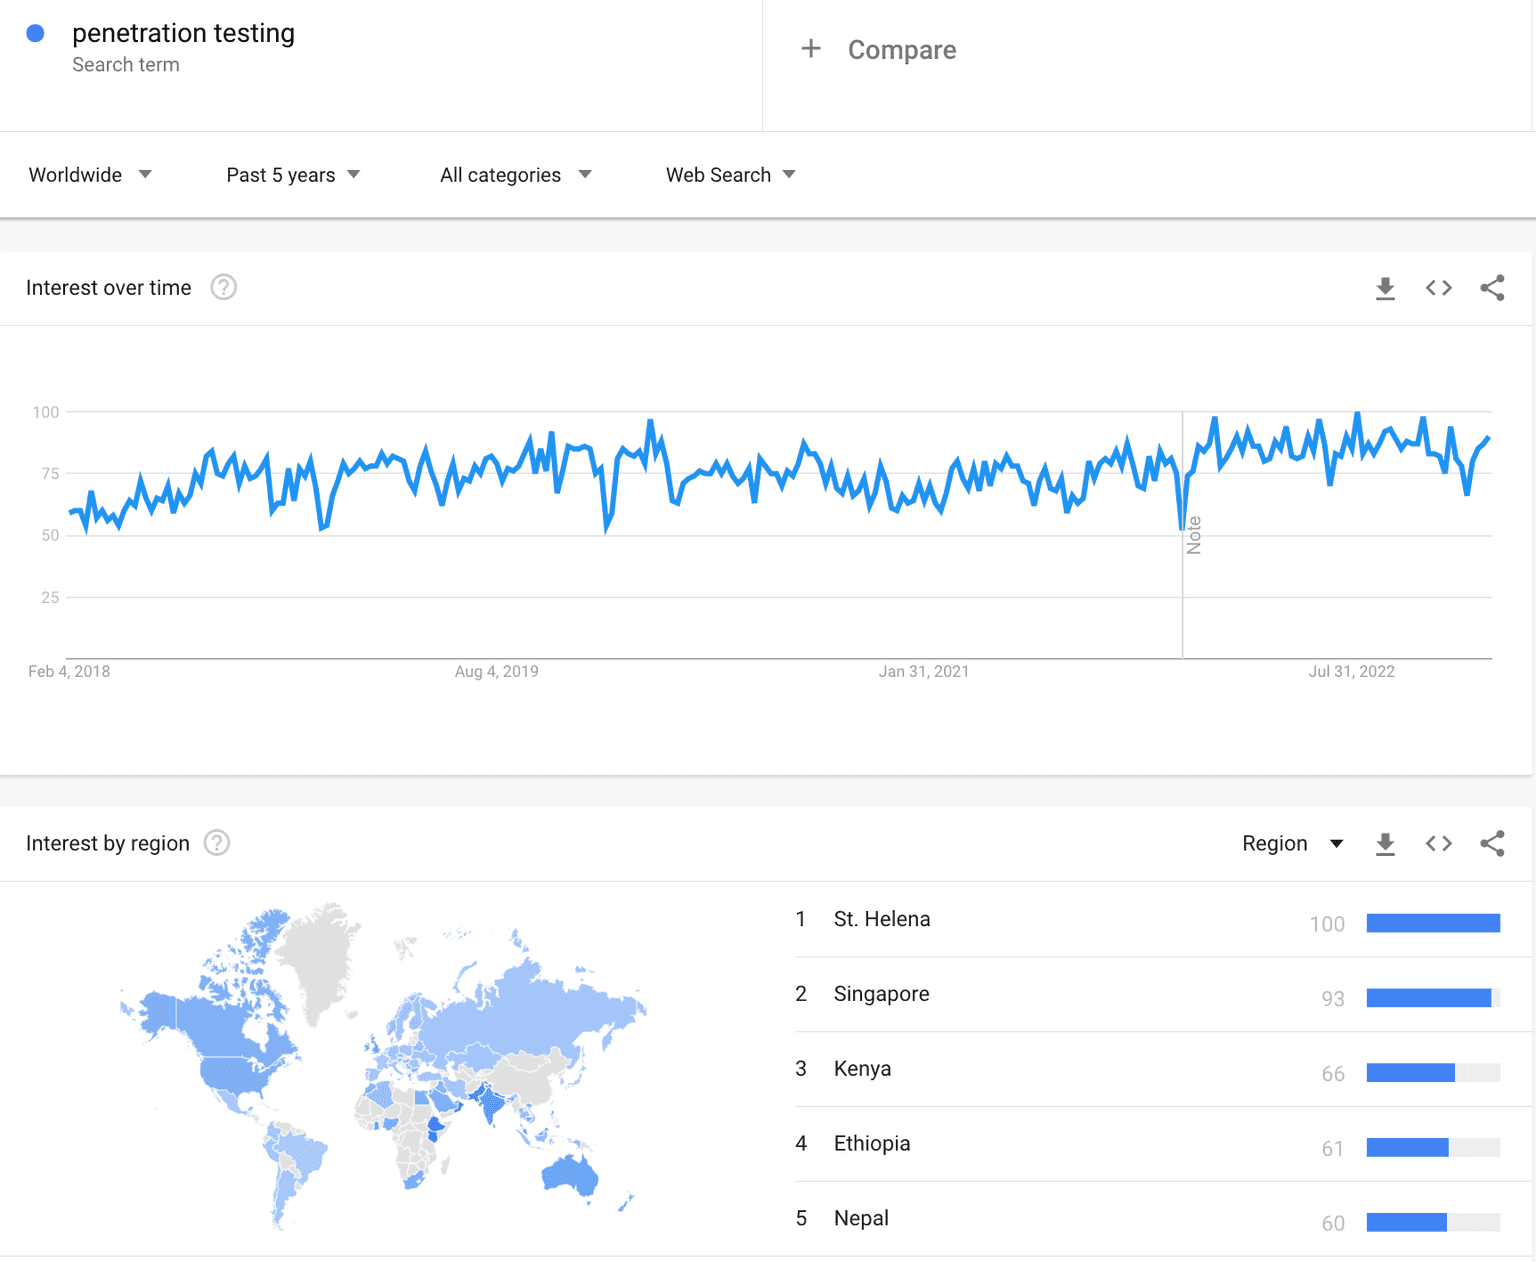
Google Trends reveals that interest in “penetration testing” has been slowly and rather steadily growing for the past 5 years.
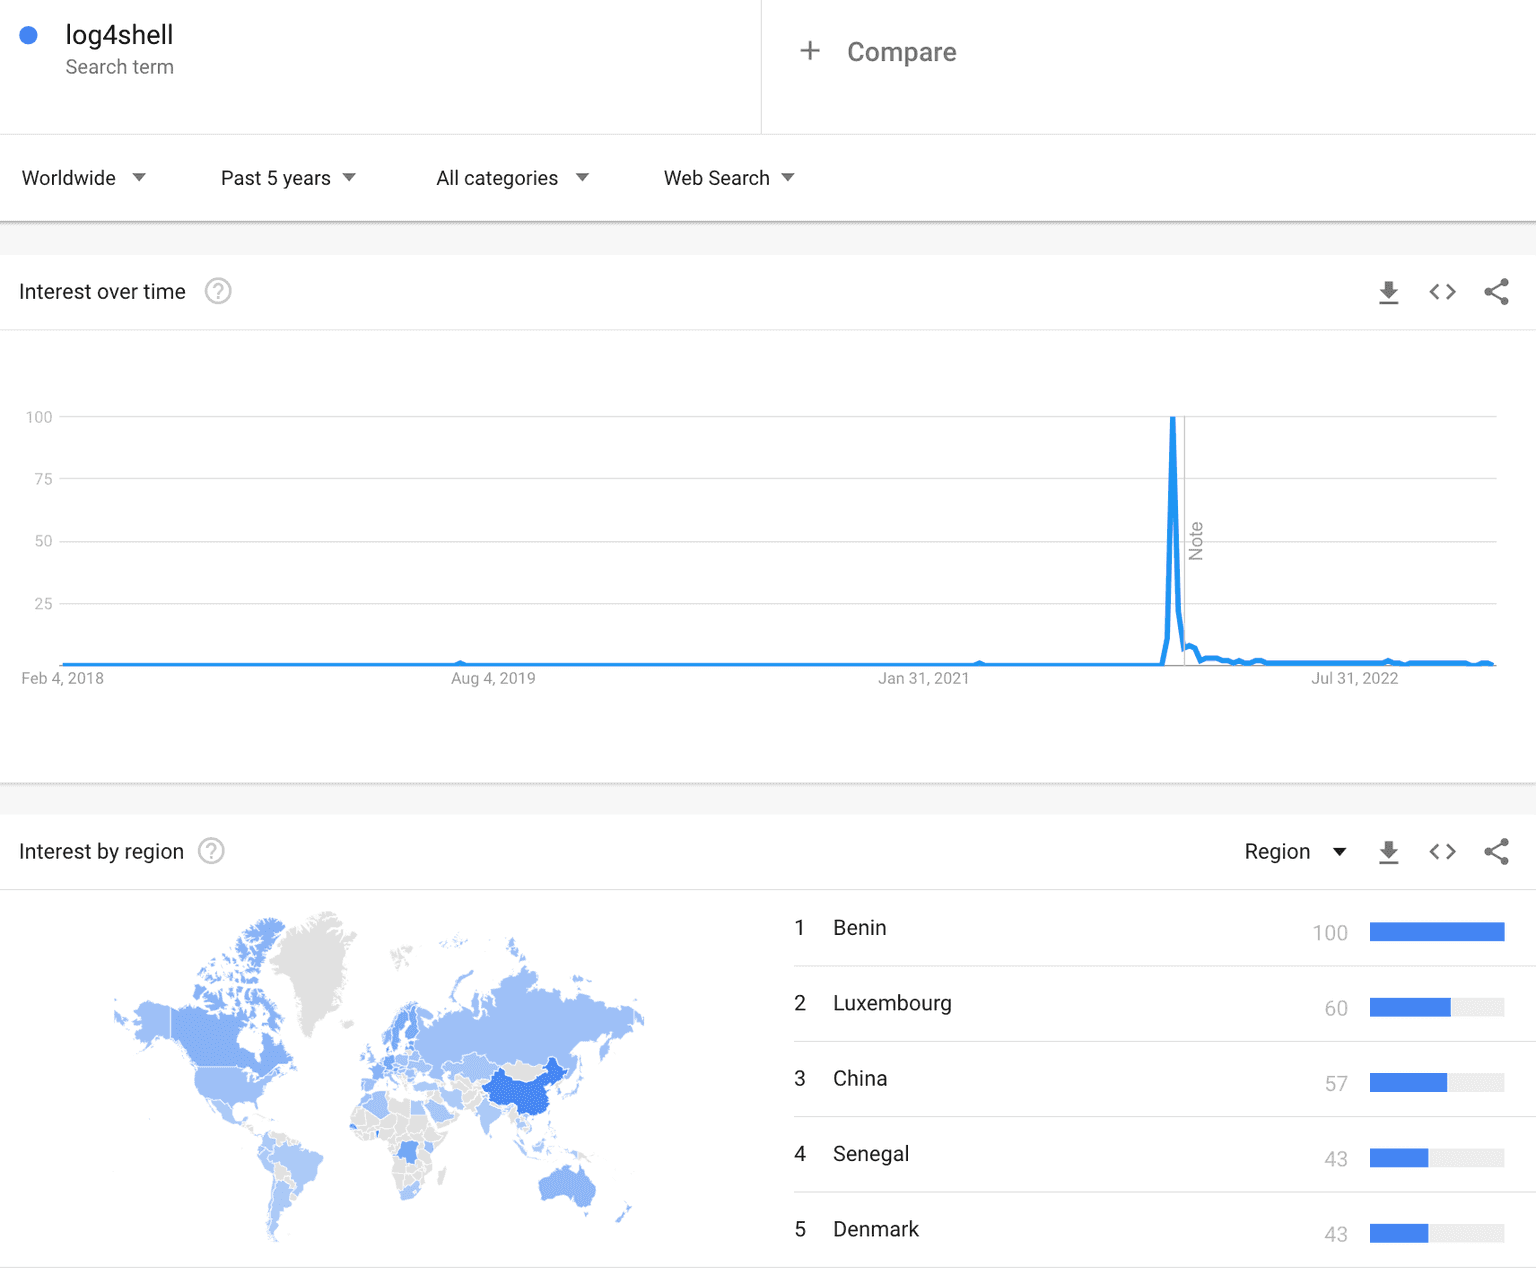
When Log4Shell (CVE-2022-44228) hit the entire infosec community (and the world), there was a high peak in December 2021 of those who searched for “log4shell”.
The top 3 related topics Internet users also searched for are web application, security, and server-computing.
Curious to know what searching for “penetration testing'' on YouTube will get you?
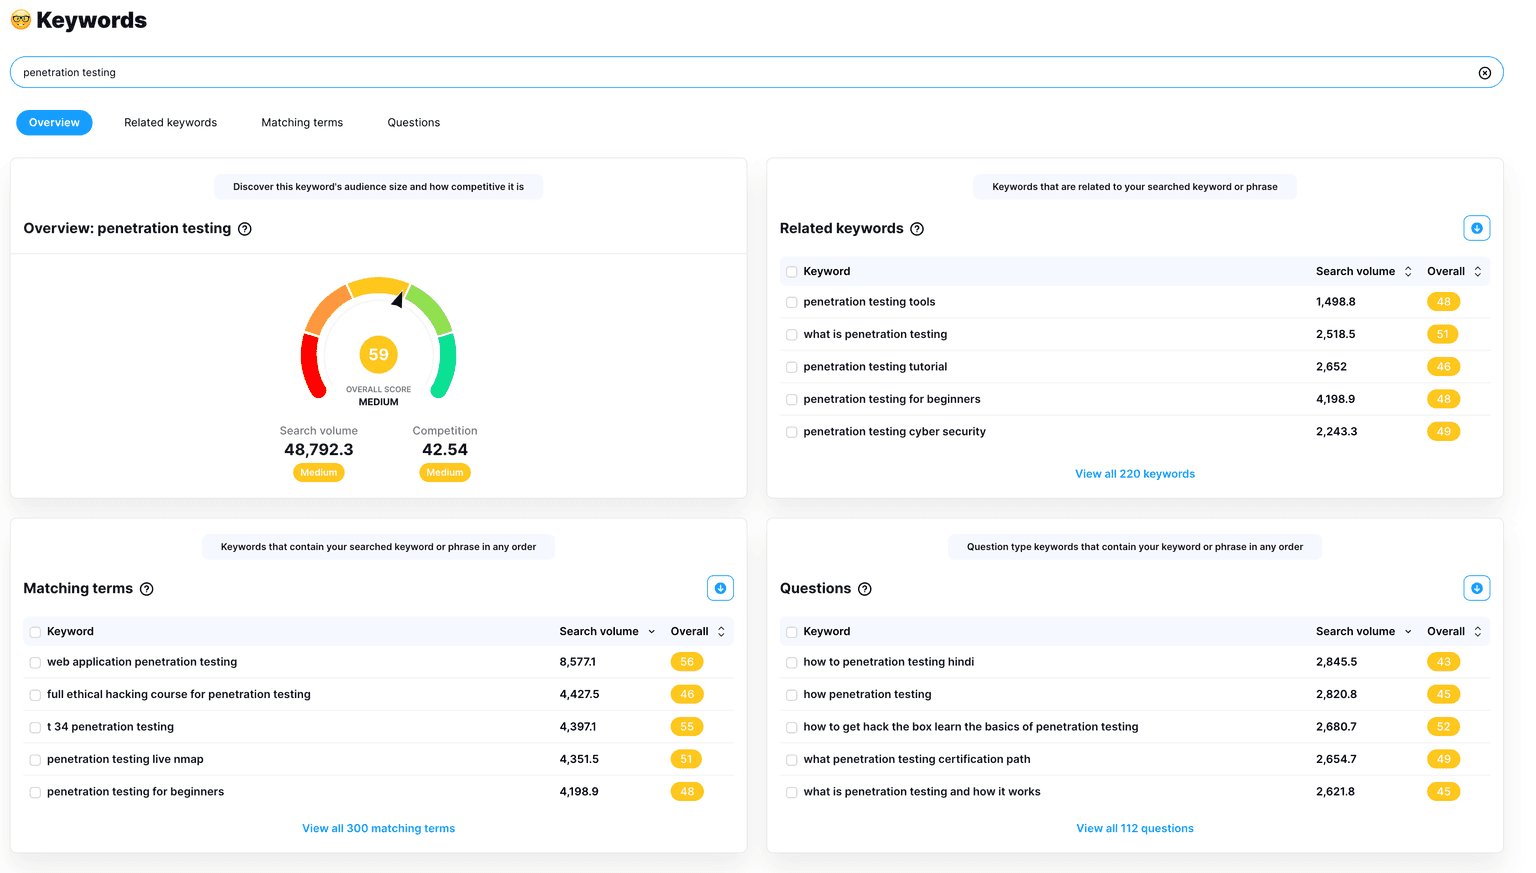
vidIQ results show a medium interest in this topic on YouTube, with an average score of 59 for penetration testing and a score of 56 for pentesting.

The Hacker News: 416k+ followers
Offensive Security: 411k+ followers
Hack the Box: 377k+ followers
TryHackMe: 282k+ followers
EC-Council: 277k+ followers
SANS Institute: 255k+ followers
Black Hat Ethical Hacking: 218k+ followers
HackerOne: 214k+ followers
Pentester Academy: 213k+ followers
Rapid7: 131k+ followers
The Pentest-Tools.com LinkedIn community keeps growing every day with followers from all over the world. It's the place that brings together like-minded people who share different perspectives and hands-on experiences for ethical hackers and pentesters like you.
Want to know which fellow penetration testers share valuable insights on this topic and are worth your time?
Follow and learn from these 10 infosec specialists on LinkedIn:
Jayson E. Street for his expertise in the field and practical and educational penetration testing stories he shares
Jack Rhysider for the inspiring and true stories he shares in the Darknet Diaries podcast.
Gabrielle Botbol for her hands-on pentesting experience and helpful (and free) resources she constantly shares with the community.
Fredrik Alexandersson (aka STOK) for his educational cybersecurity-related video content for the bug bounty community
Alyssa Miller for her practical, helpful resources about cybersecurity awareness, penetration testing, and other useful infosec topics.
Phillip Wylie for his 24+ years of information technology and offensive security experience. He shares insightful conversations with other infosec pros in the Hacker Factory podcast.
HD Moore, the founder of Metasploit Framework, for his vast network security expertise.
Jason Haddix has extensive hands-on penetration testing experience and advises over 300+ security programs across many industry verticals.
Jay Jay Davey has over 55,000 followers on LinkedIn and is an experienced security analyst with endless enthusiasm for this industry.
Natalia Antonova for her well-articulated OSINT stories and the fresh perspective she brings to this topic.
Do you enjoy spending more time on Twitter?
Then these top 10 pentesters and experienced infosec specialists can help expand your pentesting knowledge and add different layers of understanding and expertise to it.
Heath Adams, also known as the Cyber Mentor, offers great infosec career advice and many helpful tips on pentesting.
Chris Kubecka has over 20 years of relevant infosec experience, including in the US Air Force. Her tweets are always inspiring and focused on raising awareness and sharing her rich know-how in the field.
J Wolfgang Goerlich is an advisory CISO and infosec strategist with great views on infosec to follow and learn from.
Kim Crawley is the co-author of The Pentester Blueprint: starting a career as an ethical hacker book and a generous infosec woman who shares thought-provoking ideas with the infosec community.
Chris Truncer for his technical expertise and insightful tweets about offensive security, red teaming, and more related topics.
Chris Campbell is a security researcher and developer who gave presentations at Black Hat USA, DefCon
Simon J. Bell is an experienced security researcher who disclosed vulnerabilities that affected 27 groups within the Indian government. He shares practical infosec tips with the community.
Conda’s tweets pack lots of offensive security lessons and other practical tips he gives through educational YouTube videos to help people learn cybersecurity and pentesting.
AccidentalCISO offers high-quality content and a fresh perspective on different aspects of penetration testing to ponder.
Gabrielle Hempel is an experienced security engineer and Hacking is Not a Crime advocate who raises awareness through her educational tweets.
Penetration testing market data
Curious to dig into specific data about the penetration testing market?
Use these key statistics to evaluate the global penetration testing market and understand the main driving factors for its growth.
The global penetration testing market size is expected to grow from $1.6 billion in 2021 to $3.0 billion by 2026, at a Compound Annual Growth Rate (CAGR) of 13.8% from 2021 to 2026. (GlobeNewswire)
The US pentesting market was estimated at US$325.8 million in 2020. China, the world’s second-largest economy, will reach a market size of $705.9 million by the year 2027. (Penetration Testing Global Market 2021 Report)
In the mobile application penetration segment, the USA, Canada, Japan, China, and Europe will drive the 20.7% CAGR.
This significant growth is driven by:
The increasing demand for the protection of software-based products. Mobile and web apps will boost the growth of the global penetration testing market. Additionally, the increasing use of cloud-based security solutions is expected to fuel the demand for penetration testing, as the Mordor Intelligence Penetration testing Market Report states.
The same report also highlights an increasing number of wireless networks and the growing number of connected devices, which also generate demand for penetration testing across various industry verticals.
Penetration testing for the public sector is likely to boost future growth by 2028. (DigitalJournal)
Pentesting jobs and salaries statistics
Are you looking to join the penetration testing field?
Perhaps this overview of the current state of job opportunities and salaries around the world will help guide your career choices, no matter which stage you’re in.
The number of unfilled cybersecurity jobs grew by 350%, from one million positions in 2013 to 3.5 million in 2021. The same number of openings is predicted to be available in 2025. (CybersecurityVentures)
Employment in computer and information technology occupations is projected to grow 13% from 2020 to 2030, faster than the average for all occupations. These occupations are projected to add about 667,600 new jobs. (the US Bureau of Labor Statistics)
By 2025, nearly half of cybersecurity leaders will change jobs, 25% of them following different career paths due to work-related stressors. (Gartner)
For a more comprehensive perspective, we look at CyberSeek, which provides detailed, actionable data about career and job opportunities in this field.
Here are some interesting statistics about pentesting jobs, required skills, and salaries:
The average salary for a penetration & vulnerability tester from January 2022 through December 2022 posted online was $101,446.
66% of US online job listings for a pentester and vulnerability tester require a bachelor's degree, while only 24% ask for a graduate degree.
There were 22,075 online job openings for Penetration and Vulnerability Testers in the USA in 2021 and 27,409 jobs available in 2022.
The top 5 most common skills required by US employers for a pentester role are: Information security, Penetration testing, Linux, Python, and Java.
And we’re not done yet! Check out even more data points about salaries in both the US and European countries:
The average salary for a US penetration tester is around $90,273 per year, slightly growing from 2021 when it was around $88,012 per year. (Payscale)
An entry-level penetration tester with less than 1 year of experience can earn an average total compensation (it includes tips, bonus, and overtime pay) of $70,324. (Payscale)
An experienced penetration tester with 10-19 years of experience earns an average total compensation of $120,953. (Payscale)
The average salary per year for a penetration tester in different European countries varies from €30,968 in Italy to €42,624 in France, €44,352 in the Netherlands, or €58,151 in Germany. (Payscale)
In the United Kingdom, the salary is around £38,702. An entry-level penetration tester with less than 1-year experience can expect to earn an average total compensation (including tips, bonus, and overtime pay) of £33,822 in the UK. (Payscale)
An experienced penetration tester with 10-19 years of experience earns an average total compensation of £50,325. (Payscale)
Pentesting services key figures in 2021 & 2022
Every organization is a target for adversaries seeking to exploit the extensive and growing list of security holes in the wild.
Case in point, black hats used Remote Desktop Protocol (RDP) for internal access in 70% of attacks launched in 2021.
Their toolsets and techniques are more advanced than ever, pressing companies to prioritize and implement mitigation solutions. Using professional pentesting services can help alleviate some of the pressure.
Let’s explore key takeaways that highlight how companies do penetration tests.
74% of organizations stated they perform penetration tests for vulnerability management program support, 73% for measuring security posture, and 70% for compliance. (CoreSecurity 2021 Penetration Testing Report)
39% of organizations said they do a pentest once to twice a year in 2021, while 42% of them performed pentests in 2022. While this may help sort priorities in terms of security weaknesses, it does indicate a lack of re-testing, which is an important way to validate how effective remediation efforts are. (CoreSecurity 2021 & 2022 Penetration Testing Report)
53% of businesses exclusively enlist the services of a third-party penetration testing team they conduct annually, while 55% of them did in 2022. (CoreSecurity 2021 & 2022 Penetration Testing Report)
81% of companies stated they perform network scanning, while 68% of them focus on application testing (CoreSecurity 2022 Penetration Testing Report)
42% of respondents working at organizations said they built an in-house pentesting team in 2021, while 53% of them did it in 2022. (CoreSecurity 2021 & 2022 Penetration Testing Report)
A 2022 report by Positive Technologies reveals some interesting results of external pentesting of corporate information systems:
Pentesters succeeded in breaching the network perimeter and accessed the local network of 96% of companies.
The average time for penetrating a local network was 5 days and 4 hours. The fastest attack (gaining access to a LAN) took just one hour.
Attack vectors identified at all companies were vulnerabilities and flaws in web application configurations.
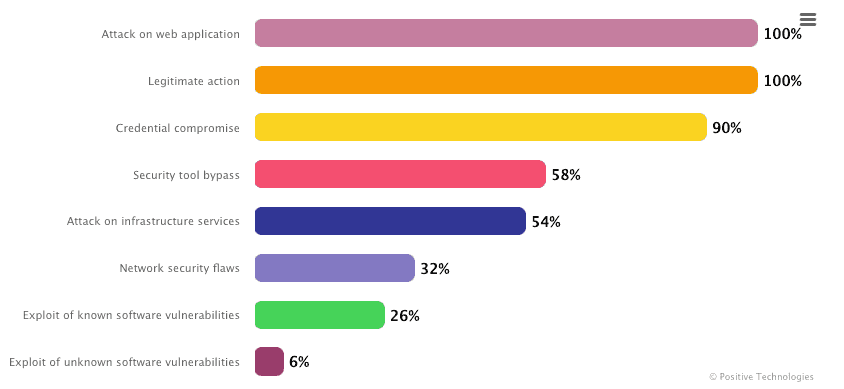
In the same report, they also showcased the results of their internal penetration testing.
Here are some useful numbers to look at:
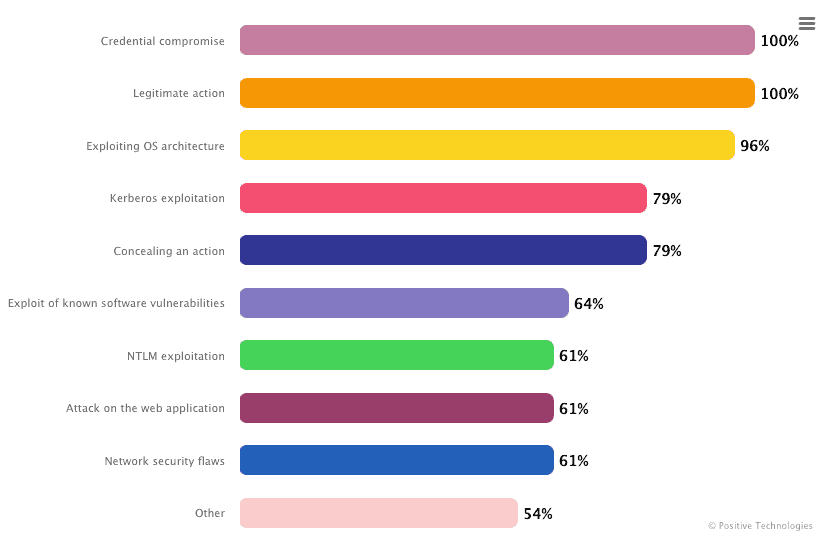
Pentesters gained full control of infrastructure at all 100 tested companies. Usually, it took about five days to get maximum privileges in an organization’s domain and 10 days to trigger a business-critical event.
For 57% of the companies, they found at least one simple way to obtain control of infrastructure.
In 85% of organizations, pentesters detected password policy flaws, while for 60% of them, they discovered high-risk vulnerabilities linked to outdated software versions.
In all tested organizations, pentesters mainly used password spraying (49%) and password guessing (33%). Sometimes, they tried password cracking (16%) sub-techniques.
Credential brute force and legitimate actions were the most frequently used techniques in the tested organizations.
Penetration testing software products to evaluate
Trying to figure out how this industry will evolve, BusinessWire points out that the global penetration testing software market is expected to grow from US$ 1,411.9 million in 2021 to US$ 4,045.2 million by 2028. It is estimated to grow at a CAGR of 14.4% from 2021 to 2028.
The COVID-19 pandemic has hastened the shift to a work-from-home model, which has increased the adoption of penetration testing software in the enterprise environment.
Hence, the penetration testing software business in North America has benefited from the pandemic due to the presence of the US and Canada, wide-scale internet usage, and the presence of major penetration testing software providers in the region., as BusinessWire added.
Using the right penetration testing software product can make a huge difference in your work. If it provides a user-friendly interface, simplifies your workflow by automating manual tasks, and helps you check for high-risk vulnerabilities – fast.
That’s why we’ve collected a useful list of top pentesting products based on the number of reviews gathered from the user community.
Here are the top 10 penetration testing software solutions based on reviews, including data aggregated from online sources and social networks on G2.
Cobalt.io
Metasploit by Rapid7
HackerOne
Beagle Security
Verizon Penetration Testing
SQLmap
Acunetix by Invicti
Check out the 7 penetration testing software contenders on the market, ranked by G2:
Metasploit by Rapid7
Acunetix by Invicti
Indusface WAS
Core Security
Veracode Application Security Platform
Bugcrowd
SQLMap
Another helpful top includes the 10 Application Security Testing products designed to analyze and test applications for security vulnerabilities. We based this list on the number of reviews on Gartner Peer Insights:
Veracode
Checkmarx SAST
InsightAppSec by Rapid7
Burp Suite Professional
Web Application Scanning (WAS) by Qualys
Acunetix by Invicti
WhiteHat DAST by Synopsys
AppScan by HCL Technologies
Invicti (formerly Netsparker)
Micro Focus Fortify Static Code Analyzer
Looking for a vulnerability management product? Check out the 9 highest-rated vulnerability management products (out of 252) on Capterra:
Beagle Security
PDQ Deploy
Hackrate Bug Bounty Platform
DriveStrike
Cyber Chief
Runecast Analyzer
TOPIA
Centraleyezer
Automox
System Mechanic Ultimate Defense
The same platform provides a useful list of the top 10 vulnerability management software (out of 252) based on the number of user reviews:
Malwarebytes for Business
PDQ Deploy
WebTitan
Nessus by Tenable
System Mechanic Ultimate Defense
Elastic Stack
Syxsense
SiteGround
Automox
Orca Security
Penetration testing regulations data
“Does my organization need to adhere to penetration testing regulatory compliance and laws?” is one question you might ponder.
Organizations worldwide are required to comply with various regulatory standards and laws in information security.
Let’s see how many of them focus on compliance and why it matters.
75% of the infosec professionals surveyed reported they perform penetration tests for compliance. It’s a 5% increase in compliance from the 2021 survey. (CoreSecurity 2022 Penetration Testing Report).
71% of respondents reported pentesting is important for their compliance initiatives. while only 4% said it’s not at all important. (CoreSecurity 2022 Penetration Testing Report)
58% of the infosec pros said their organizations use third-party pentesters to meet compliance requirements. (CoreSecurity 2020 Penetration Testing Report)
81% of them use third-party pentesters for network testing assessments, while 68% do application testing and 48% perform cloud security engagements. (CoreSecurity 2022 Penetration Testing Report)
66% of respondents struggle to maintain high-quality security standards, particularly around compliance (Cobalt The State of Pentesting 2022)
Red teaming assessment statistics
How do red teams help organizations validate security controls effectively and make them more resilient against cyberattacks? Do they choose in-house red teams or do they outsource this process?
The data points below provide useful insights on how companies perform red teaming assessments.
47% of organizations believe that red teaming is a best practice for risk assessment and use these techniques to uncover unknown vulnerabilities. (2022 ESG Research Report Security Hygiene and Posture Management)
39% of organizations do red teaming after experiencing security incidents. (2022 ESG Research Report Security Hygiene and Posture Management)
37% of them conduct red teaming assessments once a month or less. When they do perform these tests, they tend to do so on a limited basis (e.g. on a single application, data center, network segment, etc.) (2022 ESG Research Report Security Hygiene and Posture Management)
Data shows companies worldwide realize that red teaming assessments are an excellent way to test their security posture.
92% of companies see significant value and perform red team testing, compared to 72% in the previous year. (2020 Red and Blue Team Survey)
They use external firms to perform red team exercises regularly. Of those, 1% perform tests once a month or more, 25% once every 2-6 months, 39% once every 7-11 months, and 27% once a year. (2020 Red and Blue Team Survey)
54% believe internal and external red teams are effective in testing blue units. (2020 Red and Blue Team Survey)
The same survey reveals that 98% of companies have increased their security investment as a result of red and blue team exercises.
The results of these assessments are positive and help organizations become more resilient, as cybersecurity statistics indicate:
Businesses that conducted red team testing exercises reduced the cost of a breach by an average of $204k. (The 2022 Cost of a Data Breach report by IBM)
By combining red-team exercises with automated tools like breach and attack simulation (BAS), organizations can improve the efficacy of red-team exercises.
94% of organizations that run red-team testing face some level of successful penetration. (Cybersecurity Red Team 101)
Ethical vulnerability exploitation insights
Let’s dive into the exploitation aspect of penetration testing and find out how offensive security specialists manage it.
The number of easily exploitable vulnerabilities is still on the rise, as statistics show time and again:
28,695 security flaws were found in 2021. It is a significant increase from the 23,269 disclosed in 2020 (RiskBased security report 2021)
4,108 vulnerabilities disclosed in 2021 were exploitable remotely. (RiskBased security report 2021)
Log4Shell saw unprecedented growth since it was discovered in late 2021. Over 1,850 vulnerability references to it and its variants. 6,200+ vendor/product combinations were impacted. (RiskBased security report 2021)
According to HackerOne’s 2022 Security report, ethical hackers succeeded in reporting over 65,000 software vulnerabilities, while in 2021, the number was slightly higher: 66,547.
The same report shows that 25% found a vulnerability and chose not to report it through a VDP (Vulnerability Disclosure Program).
However, 32% of reported vulnerabilities remain undetected by companies and open to exploitation, the Ethical Hacker Insights Report 2021 said.
Trying to understand what impacts an organization’s security technology investment decision-making, new research conducted by Ponemon Institute found that:
73% of IT security pros say they prefer to buy technology and services from vendors who are proactive about security, including leveraging ethical hacking and having transparent communications about vulnerabilities.
Interesting data about web application security testing
The increasing complexity of web applications, their diversity, and differences become the main target for malicious actors.
While web app creators try to make them secure, misconfigured web servers, unvalidated form inputs, and poorly maintained web apps offer adversaries massive attack opportunities.
That’s why it’s important to review these statistics that reflect key aspects of web application security and the attacks targeting it.
28% of the web applications tested had some exposure to cross-site scripting attacks. They are one of the most prevalent and high-risk vulnerabilities impacting web applications. (The 2021 Software Vulnerability Snapshot report)
The same report reveals that 76% of the targets included the 2021 OWASP Top 10 vulnerabilities.
Application and server misconfigurations were 21% of the overall vulnerabilities found in tests. 19% of the total vulnerabilities were linked to broken access control (The 2021 Software Vulnerability Snapshot report)
32% of companies who experienced an external attack involved web application exploits which are in the top 3 external attack vectors, alongside software vulnerability exploits (35%) and supply-chain attacks (33%). (Forrester’s State of Application Security Report 2022)
39% of all cyberattacks in 2021 aimed to exploit web applications. (Forrester’s State of Application Security Report for 2021)
In terms of minimizing risks, the same report found that 21% of security decision-makers surveyed said their companies will prioritize building security into development processes (Forrester’s State of Application Security Report for 2021)

More web application security testing stats show why cybercriminals target web applications so often.
42% of customer-facing web applications represent the highest security risk for businesses, followed by legacy apps (40%). (Cybersecurity Insiders’ Application Security Report 2022)
LFI (Local File Inclusion) attacks increased by nearly 400% year over year, surpassing SQLi attacks in 2021 and Q1 of 2022 (Akamai Web Application and API Threat Report H1 2022)
Speaking of their biggest application security concerns, infosec pros most frequently mentioned protecting data (44%) as their key concern. This is followed by the challenge of keeping up with the rising number of vulnerabilities (42%) and threat and breach detection (38%). (Cybersecurity Insiders’ Application Security Report 2022)
32% of organizations with a web application for file uploads do not scan all file uploads to detect malicious files (Web Application Security Report 2021)
The same report shows that 66% of organizations with a web application for file uploads are concerned about business impact, revenue loss, or reputational damage related to insecure file uploads.
Another report confirms that the number of web application attacks was 239% higher than that of the first half of 2020 and exceeded that of the entire volume of 2020, reaching 10.113 billion (CDNetworks State of the Web Security for 2021)
On average, 750 organizations were breached twice in 12 months in 2021 as a direct result of a web application vulnerability (Barracuda The State of Application Security in 2021)
Bot-based attacks are a key contributor to successful security breaches resulting from web application vulnerabilities (Barracuda The State of Application Security in 2021)
Bug bounty programs statistics
Bug bounty programs remain one of the most cost-effective ways to continuously test web applications and networks, and improve the cybersecurity posture of organizations with complex technology stacks and business flows.
To highlight the importance of these assessments, we collected some key data:
Ethical hackers reported 66,547 valid bugs in 2021, a 21% increase from the previous year. (Hacker-Powered Security Report 2021 by HackerOne)
80% of customers who use HackerOne run private bug bounty programs and they are likely to yield higher results (with less competition among bug bounty hunters) than a mature public program (Hacker-Powered Security Report 2021 by HackerOne)
While traditional bug bounties saw a 10% increase in findings in the past 12 months, Vulnerability Disclosure Programs (VDPs) saw 47% vulnerability growth, and hacker-powered pentests rose 264% (Hacker-Powered Security Report 2021 by HackerOne)
Cross-site scripting, information disclosure, and improper access control are the top 3 vulnerabilities ethical hackers discovered and were most rewarded for on HackerOne in 2021.
The average price of a critical bug rose from $2,500 in 2020 to $3,000 in 2021. (Hacker-Powered Security Report 2021 by HackerOne). But the average payout increased by 315%, from $6,443 in 2021 to $26,728 in 2022.
79% of bug bounty hunters do this work to learn, while money is a second motivator for 71% of them. 59% said they do it for fun. (HackerOne’s 2022 Security report)
50% of ethical hackers chose not to disclose a vulnerability because the company has previously been unresponsive or difficult to work with, or there was no channel through which to disclose it. (HackerOne’s 2022 Security report)
In 2021, Microsoft awarded $13.6M in bug bounties to over 340 security researchers across 58 countries. The largest award was $200K under the Hyper-V Bounty Program. (Microsoft Security Response Center)
1Password was another company that focused its efforts on bug bounty programs. They also increased the bug bounty reward to the largest of $1 million. (1Password blog)
Last year, Polygon Technology paid a $2 million bug bounty for a vulnerability that could have compromised $850 million in user funds. This seems to be the highest bug bounty ever paid for a vulnerability. Full vulnerability analysis and more details on Immunefi.
In 2021, vendors took an average of 52 days to fix security vulnerabilities reported from Project Zero. This is a significant acceleration from an average of about 80 days 3 years ago (Google Project Zero).
2022 was a record-breaking year for the GitLab’s Application Security team, which awarded over 1 million USD in bug bounty programs across 221 valid reports, up from $337,780 in 2021.
These pentesting statistics emphasize why vulnerability prioritization is essential for security teams. It helps them during security testing engagements to identify high-risk vulnerabilities faster.
Network security assessment statistics
How much time do organizations spend on network assessments? Do they prioritize network security vulnerability over threat intelligence?
If you wrestle with these questions, it helps to look at data to understand the bigger picture and see how others are faring:
Global cyberattacks increased by 38% per week on corporate networks in 2022 compared to 2021. (Check Point Cybersecurity Report 2022)
By comparison, 2021 saw 50% more cyberattacks per week targeting corporate networks than in 2020. This increase peaked in December, largely due to Log4J exploits (CyberSecurityIntelligence)
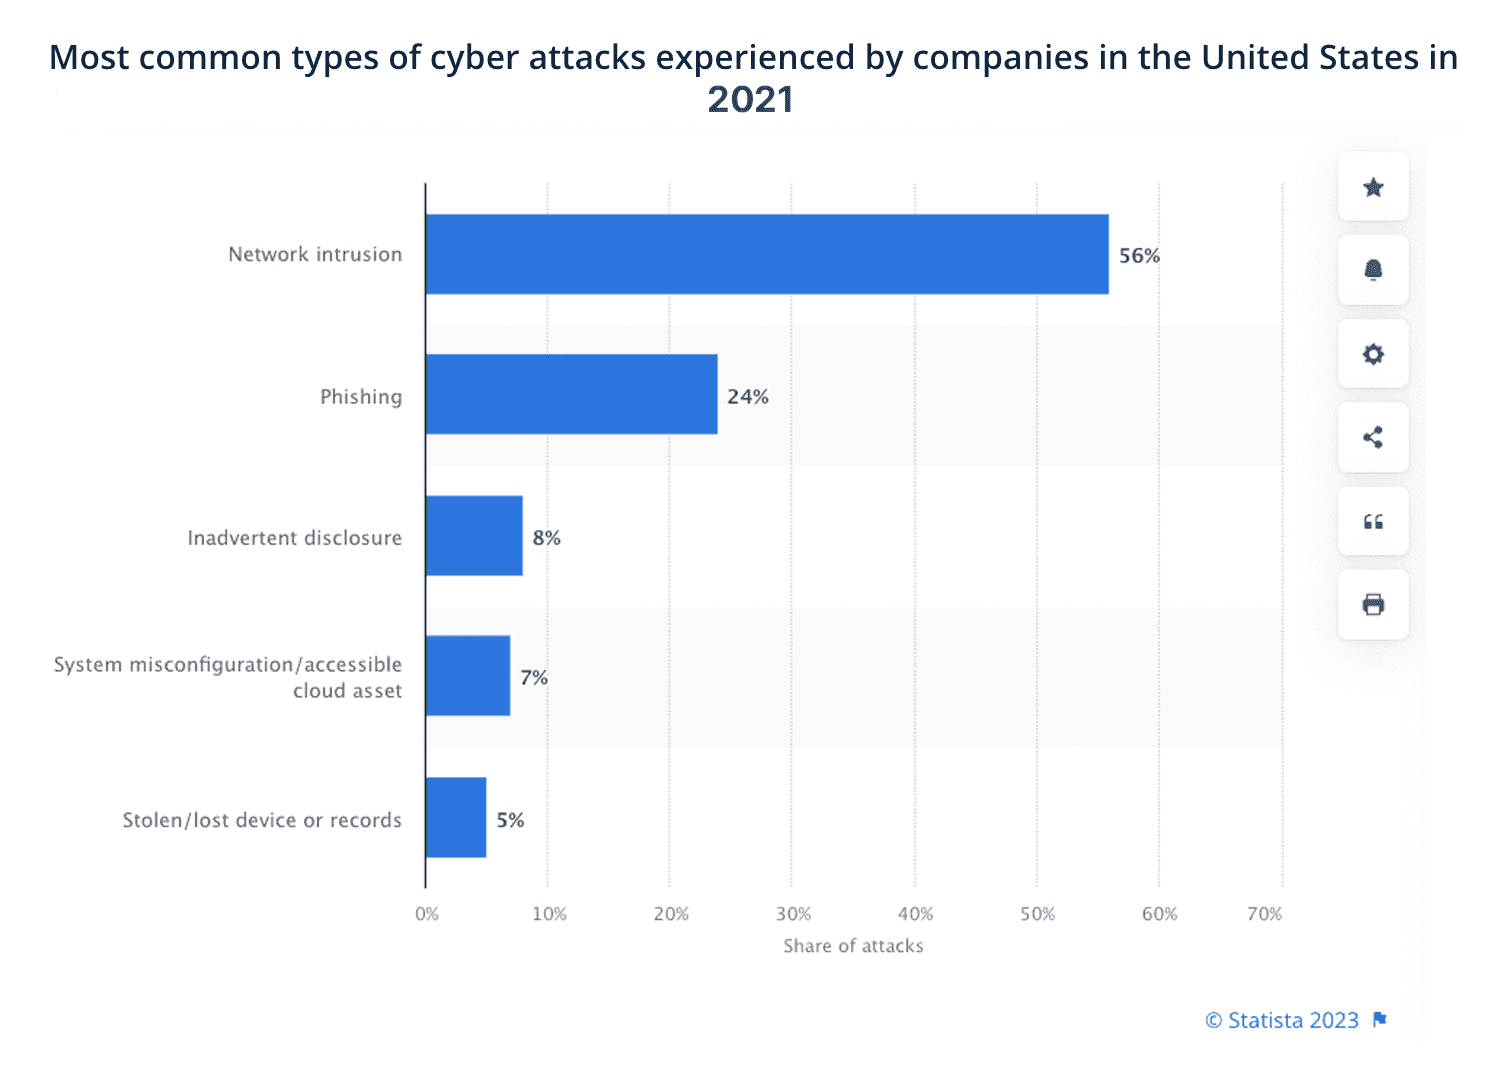
Network intrusion was the leading cause of cyberattacks experienced by US companies in 2021, reaching 56% of them. Phishing ranked second with 24% of threats (Statista)
Lateral movement is the new “battleground” as it appeared in 25% of all attacks in 2021 (VMWare Global Incident Response Threat Report 2022)
Organizations believe networks are the second most vulnerable breach point (21%), after applications (35%). (VMWare Global Security Insights Report 2021)
16.8% of all network/host vulnerabilities across companies surveyed were either high or critical risk. (Edgescan 2022 Vulnerability Statistic Report)
The average MTTR (Mean Time to Remediate) for companies to fix host/network vulnerabilities was 63.1 days. (Edgescan 2021 Vulnerability Statistics Report)
These statistics highlight the impact of network-related high-risk vulnerabilities on companies’ IT infrastructure:
About 10,000 enterprise servers running Palo Alto Networks’ GlobalProtect VPN were found vulnerable to CVE-2021-3064, a buffer overflow bug with a severity rating of CVSS 9.8. (ArsTechnica)
CVEs with a network attack vector accounted for 69% of all vulnerabilities in 2020 (Redscan report)
In 93% of local companies’ networks, cybercriminals can breach them and gain a foothold in the internal network (Positive Technologies Research Report 2021)
The same report highlights that, on average, it takes two days to penetrate a company’s internal network.
6422 web pages include Zabbix deployments potentially vulnerable to CVE-2022-23131.
The oldest vulnerability discovered in 2020 was 21 years old (CVE-1999-0517). It impacted the Simple Network Management Protocol version 2 (SNMPv2), used for managing devices and computers on an IP network. (Edgescan 2021 Vulnerability Statistics report)
The global network security market will grow from $27.39 billion in 2021 to $60.38 billion in 2028 at a CAGR of 12.0% in 2021- 2028. (Fortune Business Insights)
For more penetration testing statistics and data, bookmark this guide and keep an eye on it. We’ll continue to update this resource to guide your decisions and help you maintain a big-picture view of both the industry and relevant aspects of your work.


